See also

 29.04.2025 04:32 AM
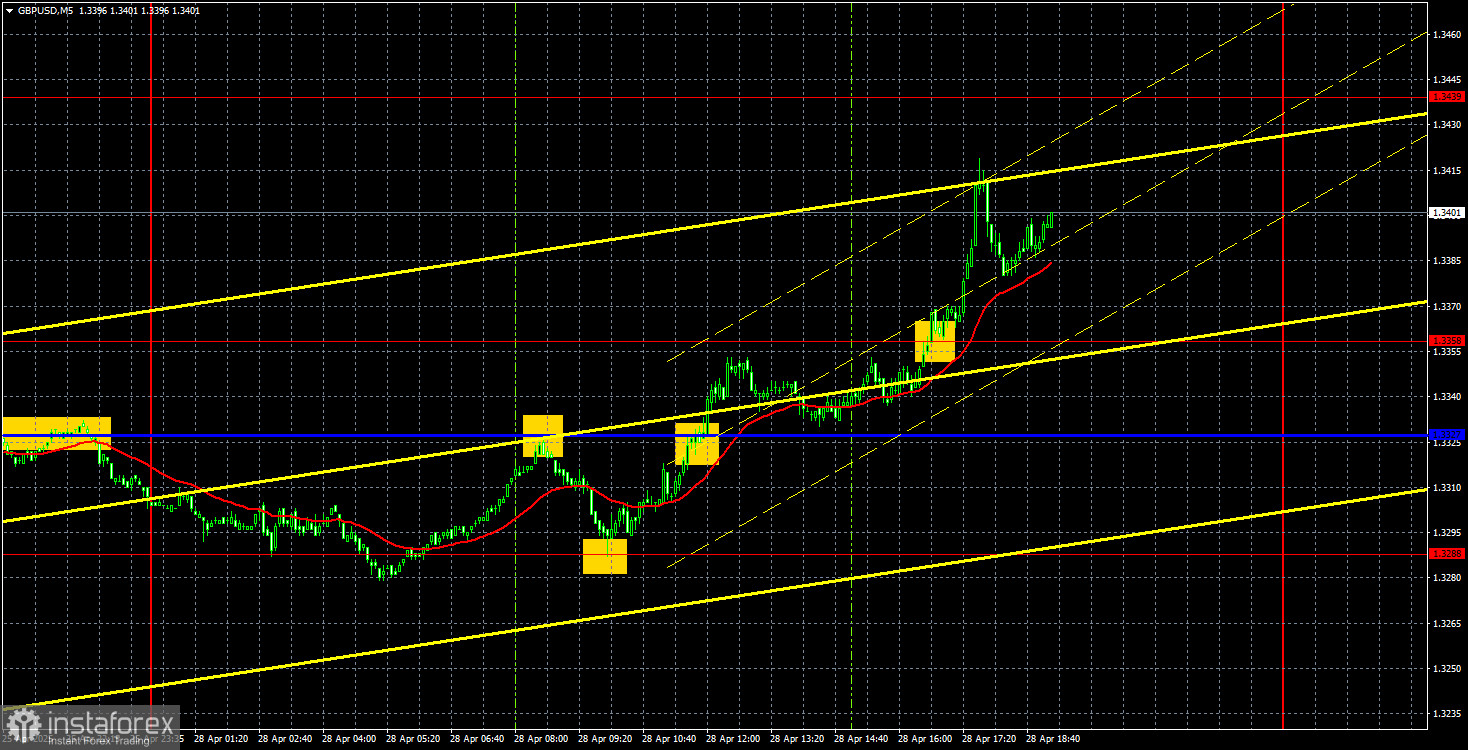
On Monday, the GBP/USD currency pair once again traded higher despite having no fundamental reasons. However, by now, all traders should be accustomed to such developments. While the euro tends to move sideways during the absence of news regarding the trade war escalation, the pound sterling still manages to rise. If the British economy showed strong results and the trade war had no bearing on it, there would be no questions. But that is not the case — the pound continues to grow almost without any real basis.
Of course, it would be incorrect to say "without any basis," as Trump's actions are a significant factor justifying a move away from the U.S. dollar. As mentioned, the dollar's decline increasingly resembles a market protest against Donald Trump. However, market participants trade as they wish. They are not required to seek permission to sell the dollar or explain their actions to others. Therefore, the situation is what it is. Given the current conditions, the dollar could continue to fall indefinitely, and correspondingly, the euro and the pound could continue rising without any intrinsic justification.
In the article on the euro, we noted that technical levels have often been ignored in recent months. However, on Monday, the technical levels for the pound worked perfectly. First, the price bounced precisely off the Kijun-sen line, then from the 1.3288 level, and afterward broke through both the Kijun-sen line and the 1.3358 level. Thus, traders could have opened three trades — all three would have been profitable.
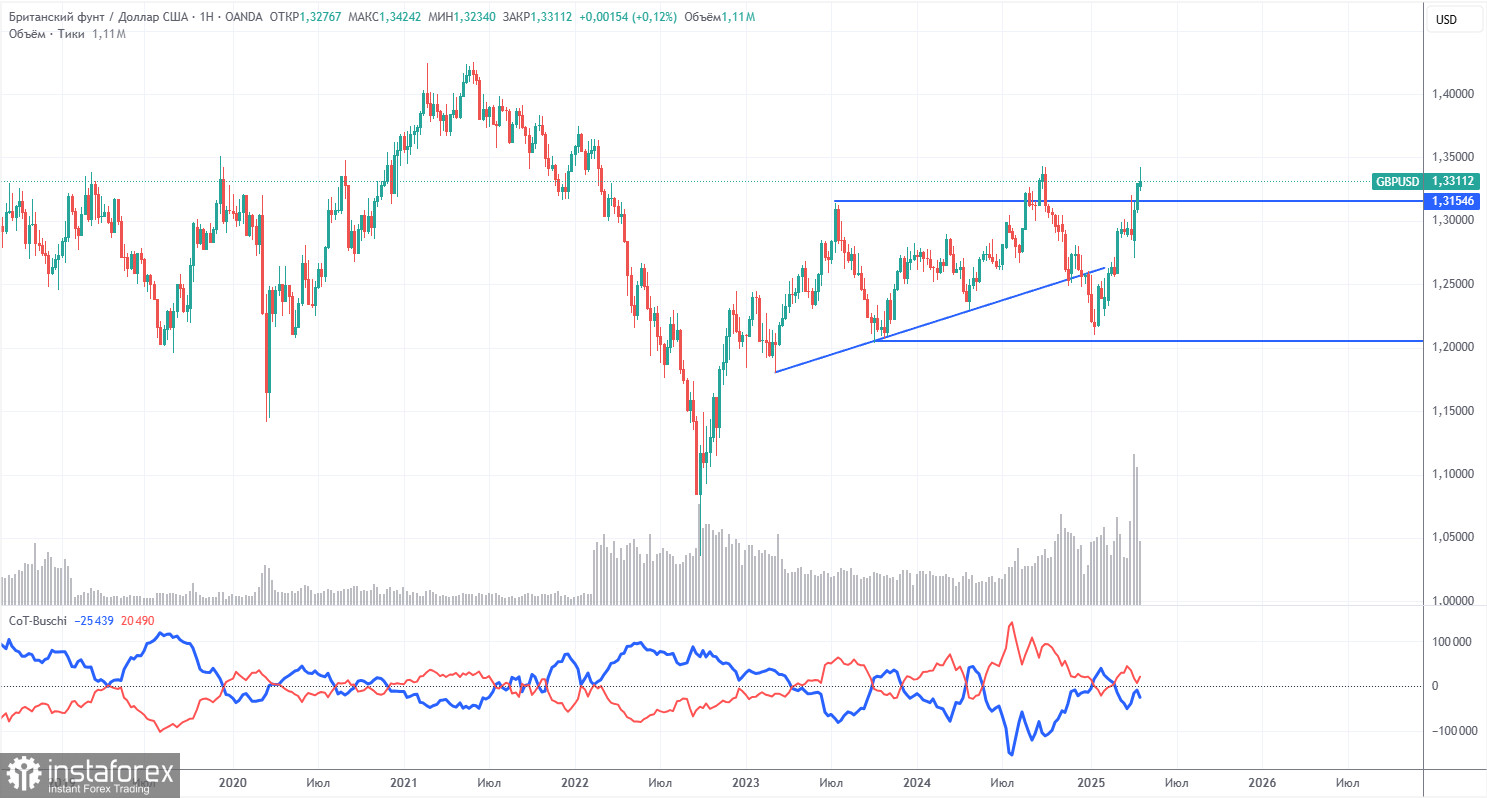
COT Reports for the British Pound show that commercial traders' sentiment has been constantly changing in recent years. The red and blue lines, representing the net positions of commercial and non-commercial traders, frequently intersect and are mostly near the zero mark. Currently, they are close to each other again, indicating approximately equal numbers of long and short positions.
In the weekly timeframe, the price initially broke through the 1.3154 level, then overcame the trend line, returned to 1.3154, and broke through again. Breaking the trend line typically means a high probability of further pound decline. However, we see the dollar consistently falling due to Donald Trump. Thus, news about the Trade War could continue pushing the pound higher despite technical factors.
According to the latest COT report for the British pound, the "Non-commercial" group opened 8,300 BUY contracts and closed 5,700 SELL contracts. As a result, the net position of non-commercial traders increased by 14,000 contracts.
The fundamental background still provides no reason for long-term pound purchases, and the currency itself realistically has chances for a continued global downward trend. Recently, the pound has risen significantly, but the reason remains the same – Donald Trump's policies.
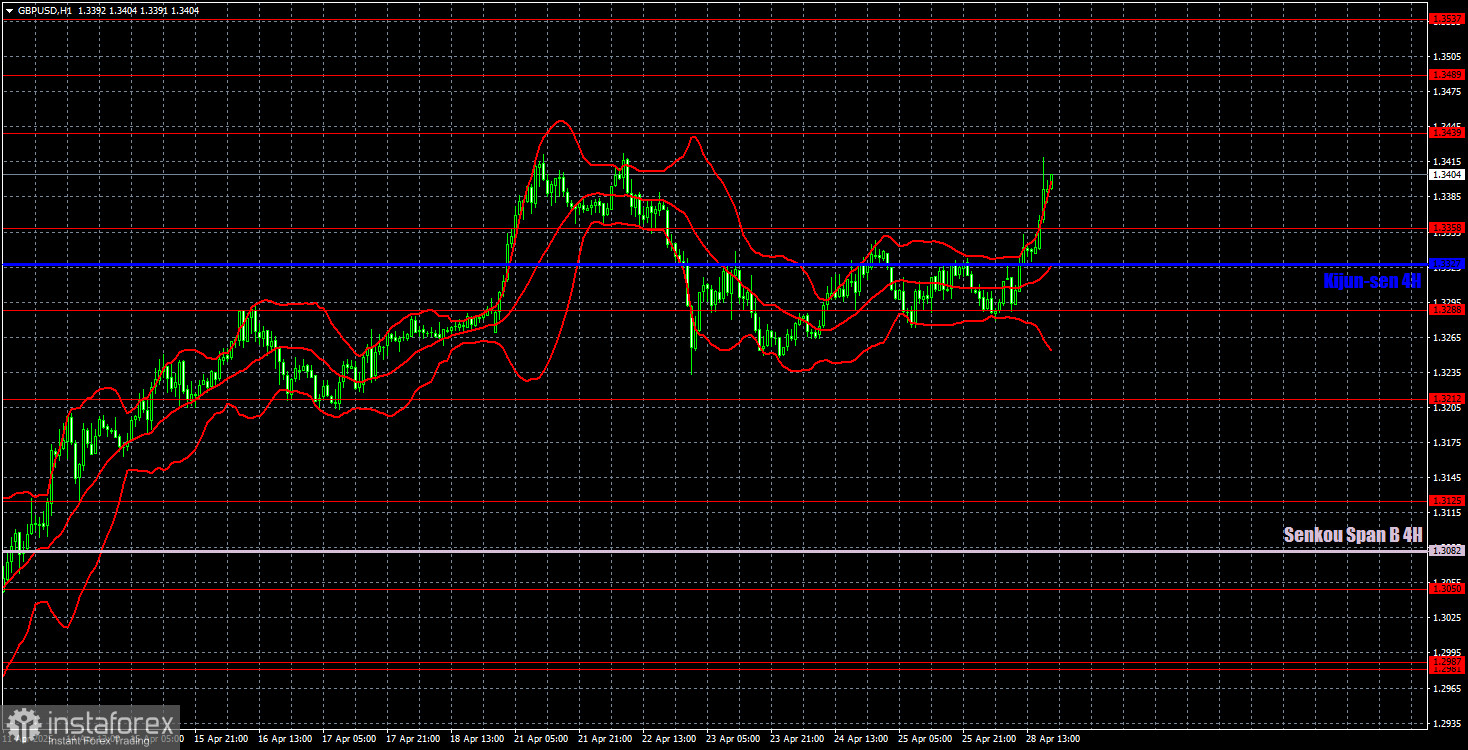
On the hourly timeframe, the GBP/USD pair paused briefly as if contemplating its next move, then resumed its upward trend. The downward correction ended before it properly began — and that would not have occurred if Trump hadn't reconsidered firing Jerome Powell. The pound sterling has shown strong growth over recent months, although it bears no personal merit for this performance. The pound's entire upward movement results from the dollar's decline, provoked by Donald Trump. And this decline has not ended yet. Thus, the market remains chaotic and panic-driven, with little logic or consistency in movements.
For April 29, we highlight the following important trading levels: 1.2691–1.2701, 1.2796–1.2816, 1.2863, 1.2981–1.2987, 1.3050, 1.3125, 1.3212, 1.3288, 1.3358, 1.3439, 1.3489, and 1.3537. The Senkou Span B line (1.3082) and the Kijun-sen line (1.3327) may also serve as signal sources. Setting the Stop Loss to breakeven once the price moves 20 pips in the correct direction is recommended. Ichimoku indicator lines can shift during the day, which should be considered when identifying trading signals.
No significant events or reports are scheduled in the United Kingdom for Tuesday. In the U.S., only the March JOLTS job openings report will be released. As Monday demonstrated, even Trump's silence does not guarantee that the U.S. dollar will not fall again.


