Pola sebenarnya

Inverse Head and Shoulder
was formed on 29.04 at 04:30:24 (UTC+0)
signal strength 3 of 5
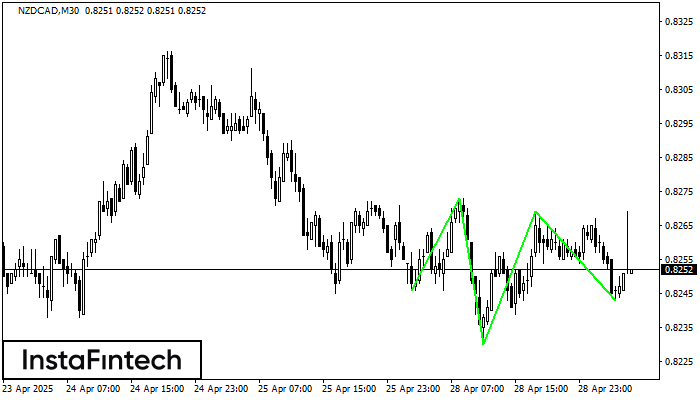
According to the chart of M30, NZDCAD formed the Inverse Head and Shoulder pattern. The Head’s top is set at 0.8269 while the median line of the Neck is found at 0.8230/0.8243. The formation of the Inverse Head and Shoulder pattern evidently signals a reversal of the downward trend. In other words, in case the scenario comes true, the price of NZDCAD will go towards 0.8299
- All
- All
- Bearish Rectangle
- Bearish Symmetrical Triangle
- Bearish Symmetrical Triangle
- Bullish Rectangle
- Double Top
- Double Top
- Triple Bottom
- Triple Bottom
- Triple Top
- Triple Top
- All
- All
- Buy
- Sale
- All
- 1
- 2
- 3
- 4
- 5
Bawah Triple
was formed on 17.05 at 17:00:17 (UTC+0)
signal strength 3 of 5

Pola Bawah Triple telah terbentuk pada #Bitcoin M30. Pola tersebut memiliki karakteristik sebagai berikut: level resistance 103658.13/103057.03; level support 102549.85/102590.27; dengan lebar 110828 poin. Jika terjadi pemecahan (breakdown) pada level
Open chart in a new window
Kepala dan Bahu Terbalik
was formed on 17.05 at 05:40:01 (UTC+0)
signal strength 1 of 5

Menurut grafik M5, #Bitcoin menghasilkan pola yang disebut Kepala dan Bahu Terbalik. The Head ditetapkan di 102549.85 sementara garis median The Neck ditetapkan di 103359.60/103319.80. Formasi Pola Kepala dan Bahu
Rangka waktu M5 dan M15 mungkin memiliki lebih dari titik entri yang keliru.
Open chart in a new window
Bawah Ganda
was formed on 17.05 at 02:15:26 (UTC+0)
signal strength 1 of 5

Pola Bawah Ganda telah terbentuk pada #Bitcoin M5; batas atas di 103642.04; batas bawah di 103357.83. Lebar pola sebesar 27887 poin. Jika harga menembus batas atas 103642.04, Perubahan dalam tren
Rangka waktu M5 dan M15 mungkin memiliki lebih dari titik entri yang keliru.
Open chart in a new window