यह भी देखें

 28.04.2025 04:14 AM
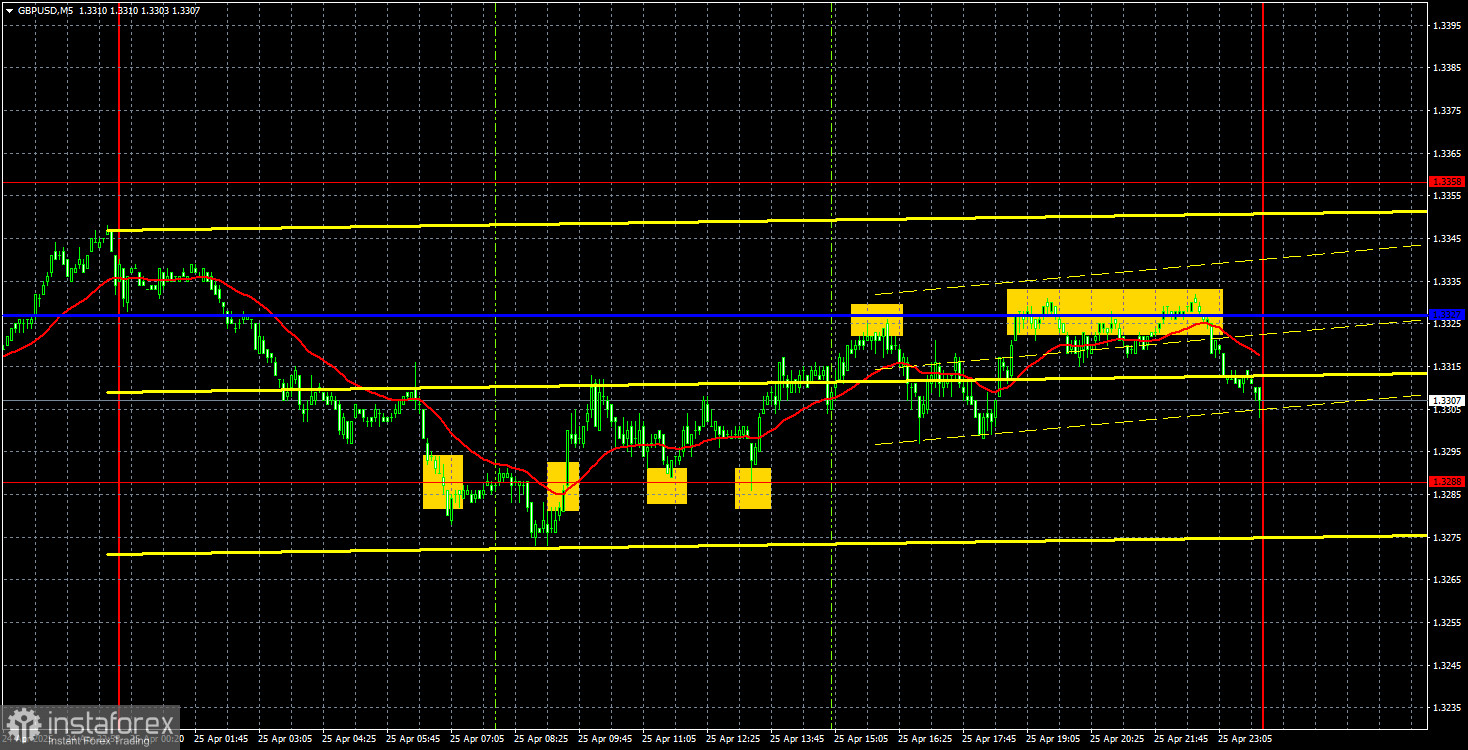
The GBP/USD currency pair continued sideways trading on Friday, holding near three-year highs. The fact that the British pound refuses even a slight downward correction shows the market's disbelief in a de-escalation of the Global Trade War initiated by Trump. Recall that markets often price in events in advance, as this is an excellent way to enter trades at the most advantageous prices, anticipating future moves. For example, the market began pricing in the Federal Reserve's monetary policy easing two years before it started.
However, the market does not currently believe in a de-escalation of the trade conflict. Despite Trump granting a grace period to countries on the "blacklist" and announcing a reduction in tariffs for China, traders see no real evidence of easing trade tensions. Moreover, China has stated that it is not conducting negotiations with the US, while the EU has indicated that it does not understand what Trump wants from them. Understandably, Trump wants more money, but the EU cannot simply respond, "Yes, of course, we will pay whatever you want."
We can currently identify a flat movement from a technical standpoint, but the upward trend remains intact and unquestioned. Consolidation below the critical line practically means nothing because no one in the market wants to buy the dollar.
The first sell signal was false on Friday, but the situation improved slightly afterward. The price generated three consecutive buy signals around the 1.3288 level, which can be considered valid. During the early American session, the pair reached the nearest target – the Kijun-sen line. A subsequent rebound from the critical line allowed for short positions, though the price did not reach the target this time.
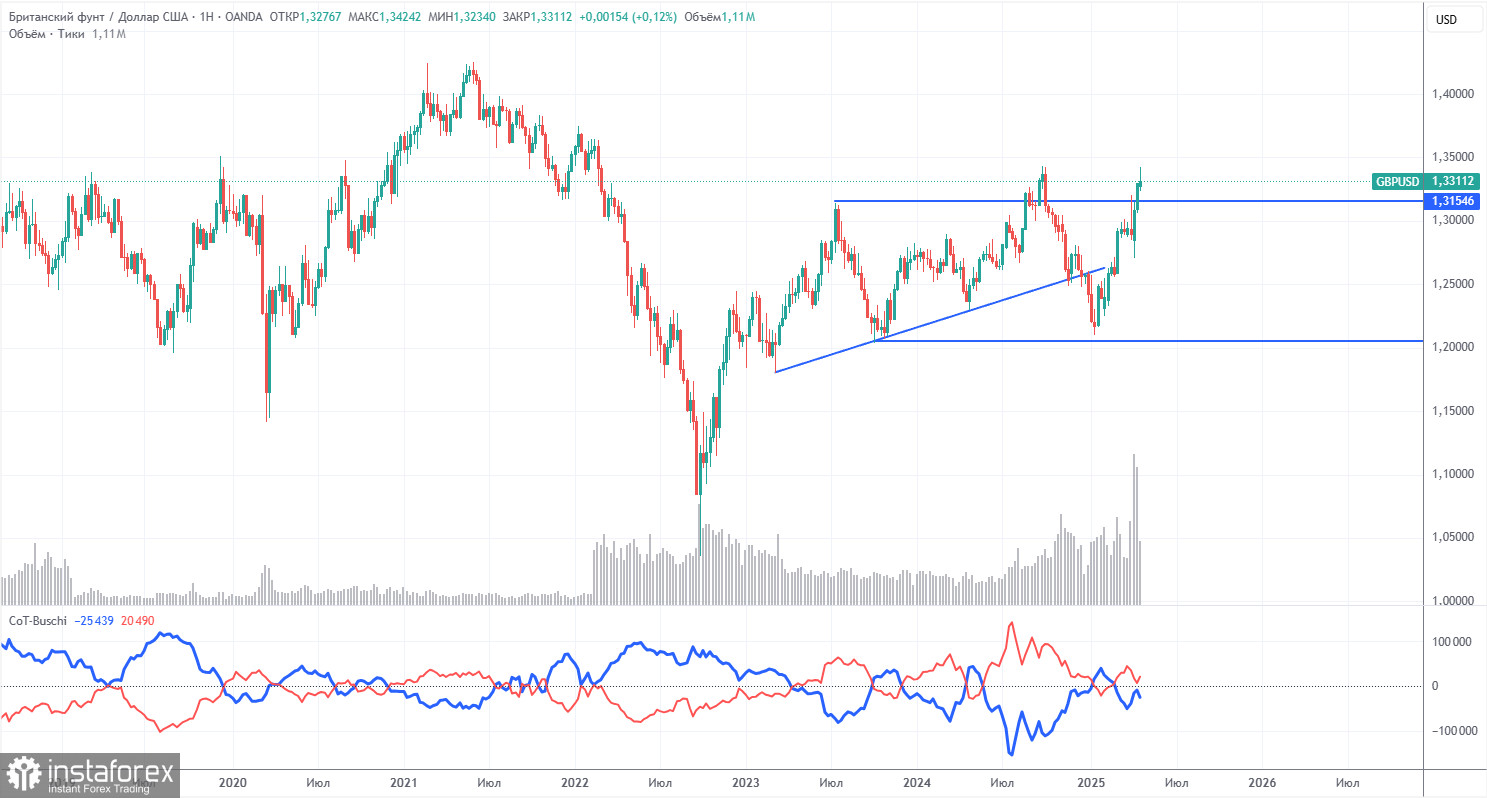
COT Reports for the British Pound show that commercial traders' sentiment has been constantly changing in recent years. The red and blue lines, representing the net positions of commercial and non-commercial traders, frequently intersect and are mostly near the zero mark. Currently, they are close to each other again, indicating approximately equal numbers of long and short positions.
In the weekly timeframe, the price initially broke through the 1.3154 level, then overcame the trend line, returned to 1.3154, and broke through again. Breaking the trend line typically means a high probability of further pound decline. However, we see the dollar consistently falling due to Donald Trump. Thus, news about the Trade War could continue pushing the pound higher despite technical factors.
According to the latest COT report for the British pound, the "Non-commercial" group opened 8,300 BUY contracts and closed 5,700 SELL contracts. As a result, the net position of non-commercial traders increased by 14,000 contracts.
The fundamental background still provides no reason for long-term pound purchases, and the currency itself realistically has chances for a continued global downward trend. Recently, the pound has risen significantly, but the reason remains the same – Donald Trump's policies.
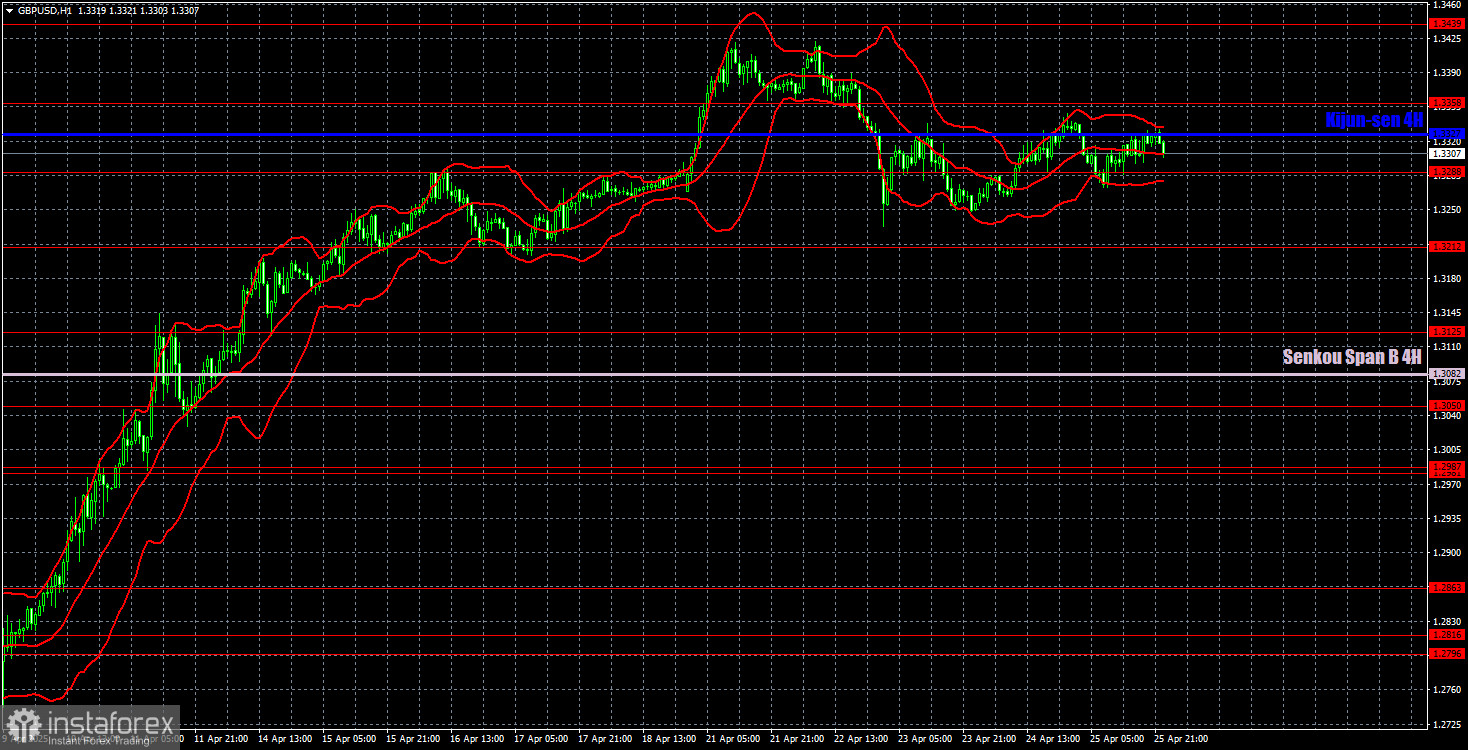
In the hourly timeframe, the GBP/USD pair showed a strong "surge" after nearly a month of flat trading, followed by an even sharper decline and a new surge. Currently, a correction is ongoing, but it remains very weak. The pound has shown impressive growth in recent months, although it has no intrinsic merit for this move. The upward movement of the pound is simply the result of the dollar's fall, which Donald Trump triggered. And the chaos, panic, and lack of logic in market movements persist.
For April 28, we highlight the following important levels: 1.2691-1.2701, 1.2796-1.2816, 1.2863, 1.2981-1.2987, 1.3050, 1.3125, 1.3212, 1.3288, 1.3358, 1.3439, 1.3489, 1.3537. Senkou Span B (1.3082) and Kijun-sen (1.3327) lines may also be signal sources. Setting a Stop Loss to break even once the price moves 20 pips in the correct direction is recommended. Ichimoku indicator lines may shift during the day, which should be considered when determining trading signals.
No important events or reports are scheduled in either the UK or the USA on Monday. If Trump continues to refrain from escalating the trade war, we can expect weak, near-flat movements.

