Actual patterns

Patterns are graphical models which are formed in the chart by the price. According to one of the technical analysis postulates, history (price movement) repeats itself. It means that the price movements are often similar in the same situations which makes it possible to predict the further development of the situation with a high probability.
Relevant patterns by InstaTrade is an easy-to-use service which allows you to be aware of latest changes in the market and react to clues from the market in time. In our service you will always find the latest and most relevant patterns on any pair and any timeframe.
Actual Patterns
- All
- All
- Bearish Rectangle
- Bearish Symmetrical Triangle
- Bearish Symmetrical Triangle
- Bullish Rectangle
- Double Top
- Double Top
- Triple Bottom
- Triple Bottom
- Triple Top
- Triple Top
- All
- All
- Buy
- Sale
- All
- 1
- 2
- 3
- 4
- 5
Double Top
was formed on 29.04 at 06:00:08 (UTC+0)
signal strength 3 of 5
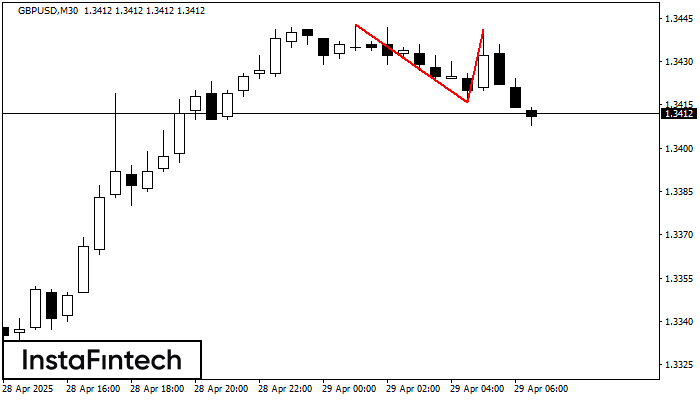
On the chart of GBPUSD M30 the Double Top reversal pattern has been formed. Characteristics: the upper boundary 1.3441; the lower boundary 1.3416; the width of the pattern 25 points
Open chart in a new window
Bullish pennant
was formed on 29.04 at 05:10:17 (UTC+0)
signal strength 1 of 5
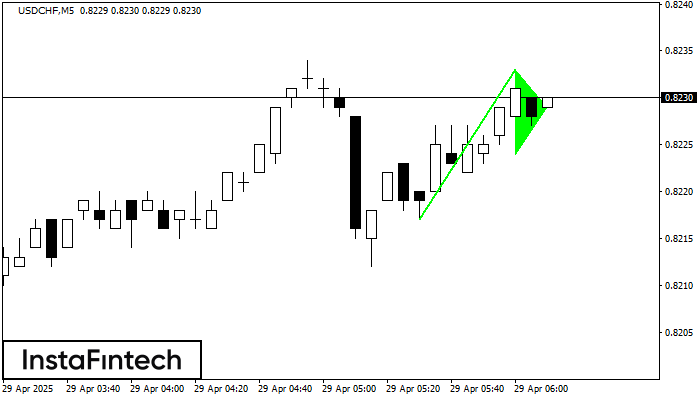
The Bullish pennant pattern is formed on the USDCHF M5 chart. It is a type of the continuation pattern. Supposedly, in case the price is fixed above the pennant’s high
The M5 and M15 time frames may have more false entry points.
Open chart in a new window
Double Top
was formed on 29.04 at 05:05:27 (UTC+0)
signal strength 1 of 5
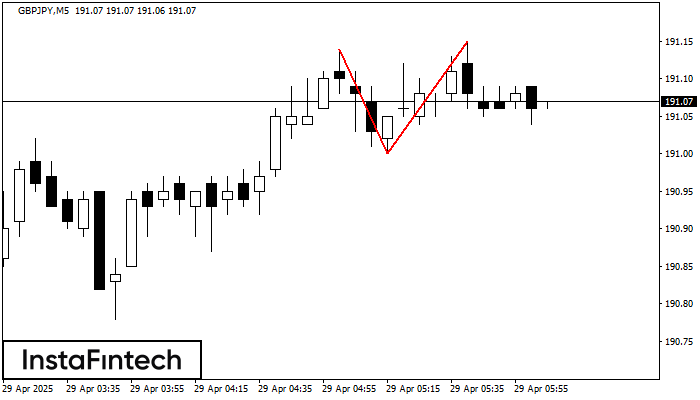
The Double Top pattern has been formed on GBPJPY M5. It signals that the trend has been changed from upwards to downwards. Probably, if the base of the pattern 191.00
The M5 and M15 time frames may have more false entry points.
Open chart in a new window
Double Top
was formed on 29.04 at 05:05:11 (UTC+0)
signal strength 1 of 5
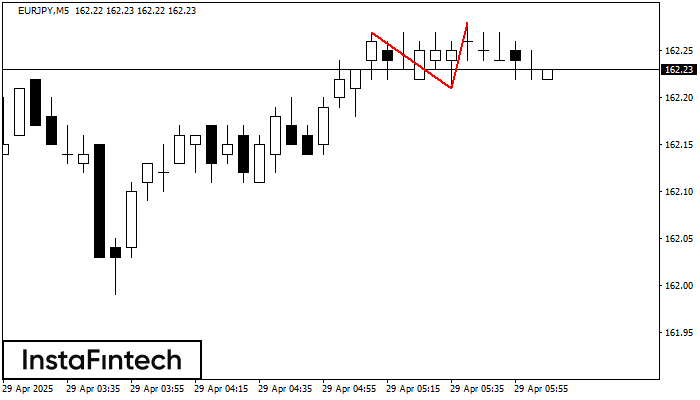
The Double Top reversal pattern has been formed on EURJPY M5. Characteristics: the upper boundary 162.27; the lower boundary 162.21; the width of the pattern is 7 points. Sell trades
The M5 and M15 time frames may have more false entry points.
Open chart in a new window
Inverse Head and Shoulder
was formed on 29.04 at 04:30:24 (UTC+0)
signal strength 3 of 5
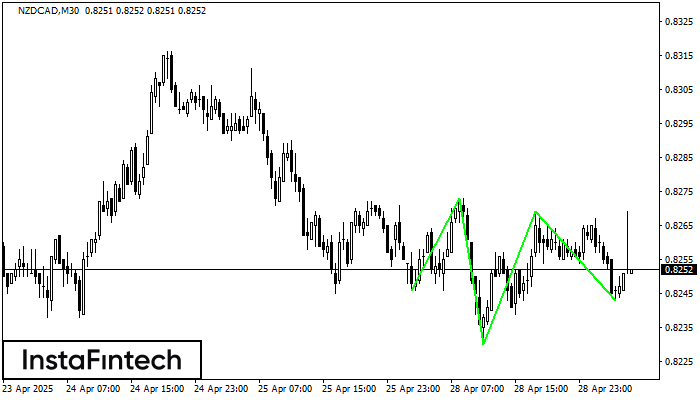
According to the chart of M30, NZDCAD formed the Inverse Head and Shoulder pattern. The Head’s top is set at 0.8269 while the median line of the Neck is found
Open chart in a new window
Double Top
was formed on 29.04 at 04:00:21 (UTC+0)
signal strength 4 of 5
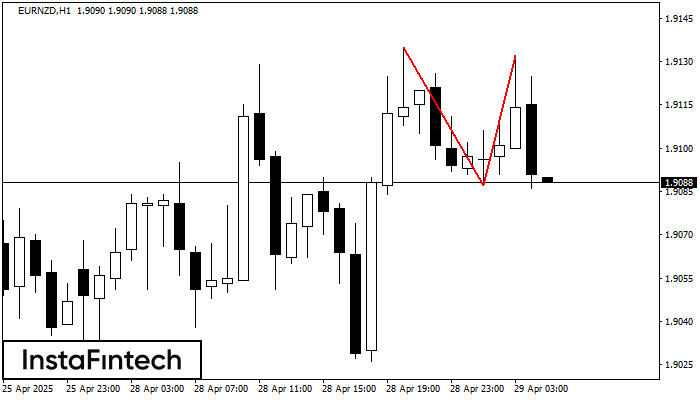
The Double Top pattern has been formed on EURNZD H1. It signals that the trend has been changed from upwards to downwards. Probably, if the base of the pattern 1.9087
Open chart in a new window
Double Bottom
was formed on 29.04 at 03:15:24 (UTC+0)
signal strength 1 of 5
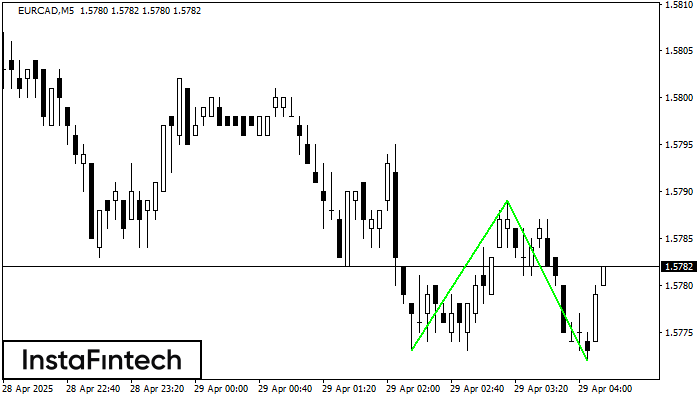
The Double Bottom pattern has been formed on EURCAD M5. Characteristics: the support level 1.5773; the resistance level 1.5789; the width of the pattern 16 points. If the resistance level
The M5 and M15 time frames may have more false entry points.
Open chart in a new window
Bullish Symmetrical Triangle
was formed on 29.04 at 02:57:48 (UTC+0)
signal strength 1 of 5
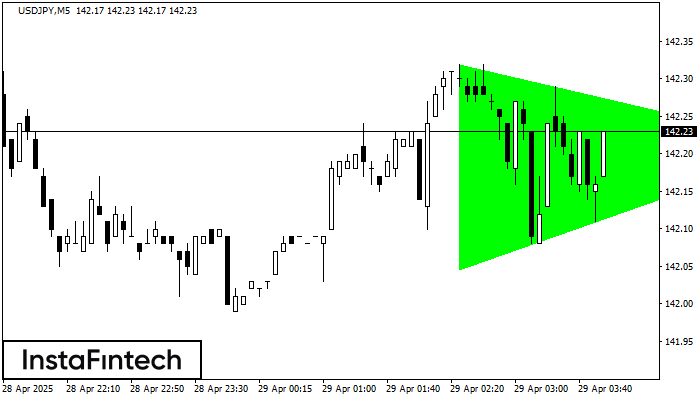
According to the chart of M5, USDJPY formed the Bullish Symmetrical Triangle pattern. Description: This is the pattern of a trend continuation. 142.32 and 142.05 are the coordinates
The M5 and M15 time frames may have more false entry points.
Open chart in a new window
Triple Bottom
was formed on 29.04 at 02:15:28 (UTC+0)
signal strength 2 of 5
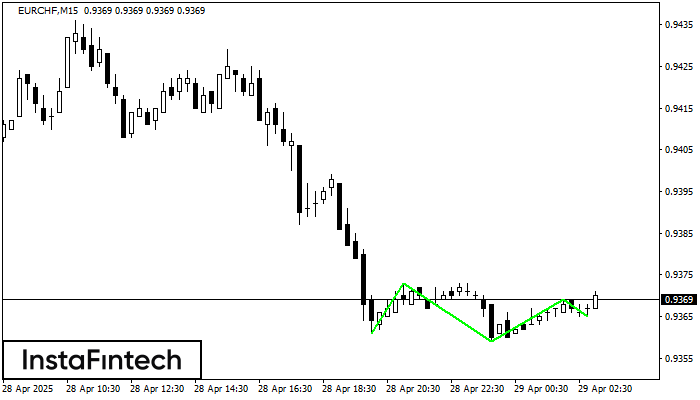
The Triple Bottom pattern has been formed on EURCHF M15. It has the following characteristics: resistance level 0.9373/0.9369; support level 0.9361/0.9365; the width is 12 points. In the event
The M5 and M15 time frames may have more false entry points.
Open chart in a new window