Lihat juga

 29.04.2025 06:55 PM
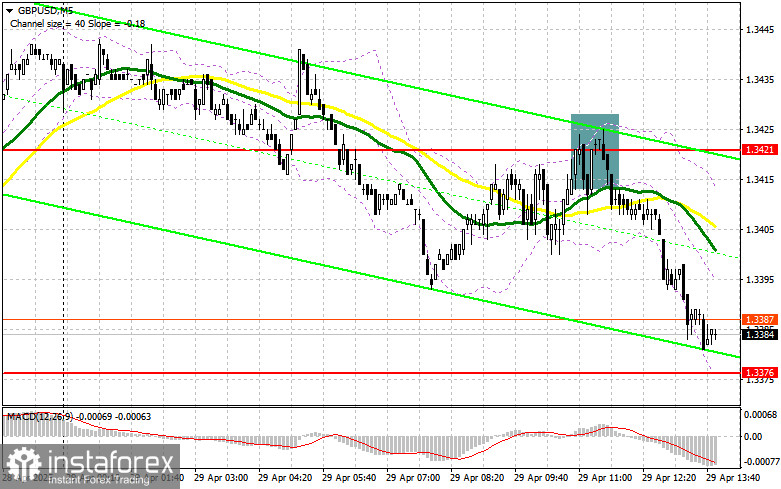
In my morning forecast, I highlighted the 1.3421 level and planned to make trading decisions based on it. Let's look at the 5-minute chart and see what happened. The pound rose and formed a false breakout around 1.3421, which created an entry point for selling the pound, resulting in a 40-point decline. The technical outlook for the second half of the day has not been revised.
To Open Long Positions on GBP/USD:
The failed attempt to break above 1.3420 led to profit-taking on the pound and a deeper correction of the pair following yesterday's rise seen during the second half of the day. During the U.S. session, the focus will shift to data on Consumer Confidence, the Goods Trade Balance, and the Job Openings and Labor Turnover (JOLTS) report from the U.S. Bureau of Labor Statistics. The first and last reports are the most critical under current conditions, as they could impact inflation and influence the Fed's position on interest rates.
If the pair declines further, I expect the first active buying efforts around 1.3376. A false breakout there would provide a good entry point for long positions, aiming to recover to the 1.3421 resistance — a level we failed to break through earlier today. A breakout and a retest from above would lead to a new entry point for longs, with the next target at 1.3462, which would help restore the bullish market. The furthest target will be the 1.3510 area, where I plan to take profits.
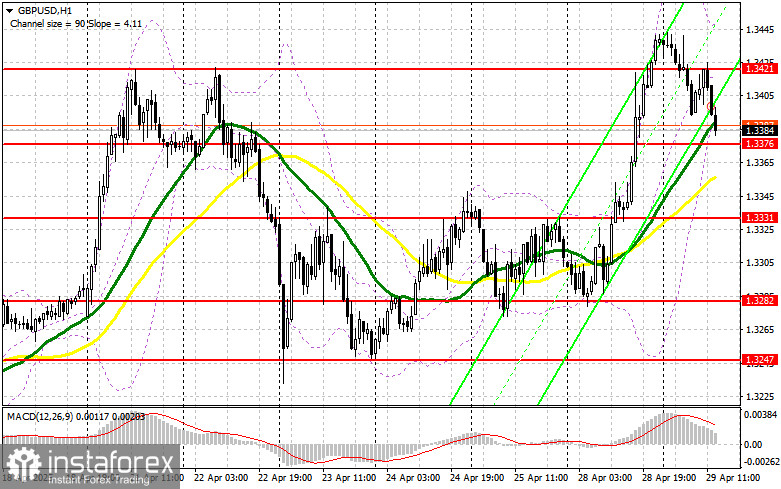
If GBP/USD declines and buyers show no activity around 1.3376 during the U.S. session, the pound's fall will likely intensify. In that case, only a false breakout around 1.3331 would provide a suitable entry point for long positions. Alternatively, I plan to open long positions immediately on a rebound from the 1.3282 support area, aiming for a 30–35 point intraday correction.
To Open Short Positions on GBP/USD:
Sellers made their presence felt during the first half of the day, leading to the pair's ongoing correction — and it seems this correction is not yet over. If the pound rises again after weak U.S. data, I plan to act exactly as I did earlier: targeting the nearest resistance at 1.3421. A false breakout at this level, similar to the one discussed above, would create a selling opportunity, aiming for a decline toward the 1.3376 support, where the battle is currently taking place. A breakout and a retest from below would trigger stop-loss orders and open the path toward 1.3331, slightly above which the moving averages supporting the bulls are located. The furthest bearish target will be the 1.3282 area, where I plan to fix profits.
If demand for the pound returns in the second half of the day and bears show no activity at 1.3421, it would be better to delay selling until the pair tests the 1.3462 resistance, which is the new monthly high. Short positions there will only be considered after a failed consolidation. If there is no downward move there either, I will look for short entries on a rebound around 1.3510, targeting a 30–35 point intraday downward correction.
Commitment of Traders (COT) Report - April 22:
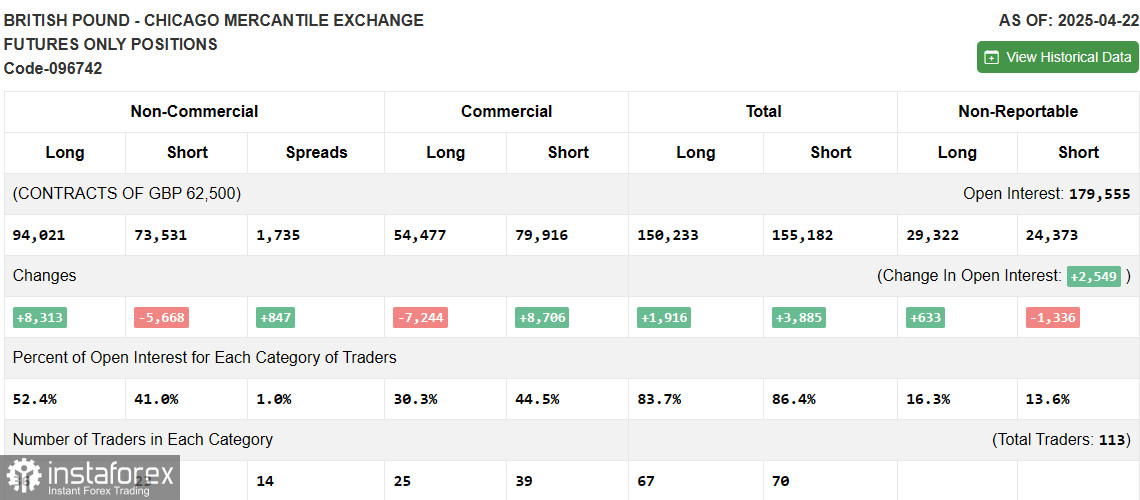
The COT report showed a rise in long positions and a decrease in short positions. Since the Bank of England is currently not planning to cut interest rates further, this fact supports the pound and allows it to continue rising against the U.S. dollar. However, the potential compromise on the U.S.-China trade deal acts as a restraining factor and maintains demand for the U.S. dollar.
In the latest COT report, long non-commercial positions increased by 8,313 to 94,021 and short non-commercial positions fell by 5,668 to 73,531. As a result, the gap between long and short positions widened by 847.
Indicator Signals:
Moving Averages Trading is taking place above the 30- and 50-period moving averages, indicating that buyers are attempting to regain control of the market.
(Note: The period and prices of moving averages are considered by the author on the H1 hourly chart and differ from the standard daily moving averages on the D1 chart.)
Bollinger Bands In the event of a decline, the lower boundary of the indicator around 1.3376 will act as support.
Indicator Descriptions:


