Vea también

 29.04.2025 06:52 PM
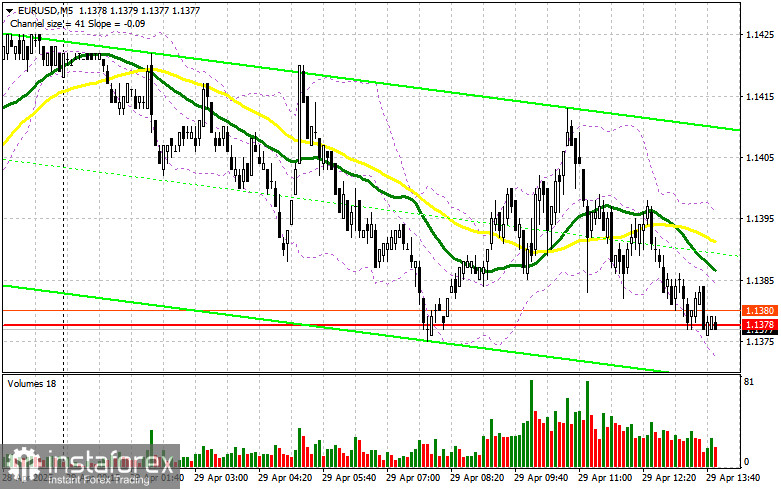
In my morning forecast, I drew attention to the 1.1378 level and planned to make trading decisions based on it. Let's look at the 5-minute chart and analyze what happened. A decline did occur, but no good entry points formed around 1.1378. The technical picture has not been revised for the second half of the day.
To Open Long Positions on EUR/USD:
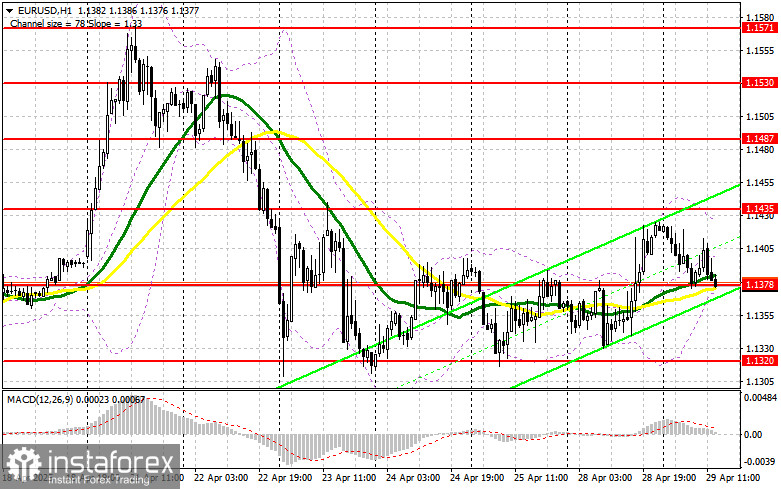
European statistics on eurozone lending provided little support for the euro in the first half of the day. During the U.S. session, pressure on the pair may intensify, as data on Job Openings and Labor Turnover (JOLTS) and Consumer Confidence from the U.S. Bureau of Labor Statistics are expected. Strong figures could lead to greater pressure on the pair, making it harder to rely on the 1.1378 level. Therefore, I plan to act on declines only from what I consider a more significant support level — 1.1320. A false breakout at that level would be a signal to buy EUR/USD, aiming for a continuation of the bullish market with a target to retest 1.1378. A breakout and a retest of this range would confirm a correct entry point for buying, with an expected rise towards 1.1435. The furthest target will be 1.1487, where I plan to take profits.
If EUR/USD declines and shows no activity around 1.1320, the pair will exit the sideways channel, possibly leading to a stronger move downward. In that case, bears could push the pair down to 1.1267. Only after a false breakout at that level would I consider buying the euro. Alternatively, I plan to open long positions immediately on a bounce from 1.1206, aiming for a 30–35 point intraday upward correction.
To Open Short Positions on EUR/USD:
In the case of euro growth amid weak U.S. statistics — which is quite possible — bears will need to assert themselves around 1.1435, which was not reached during the first half of the day. Only a false breakout at that level would provide a reason to enter short positions against the trend, targeting a decline towards 1.1378, where trading is currently taking place. This level also coincides with the moving averages, supporting the bulls. A breakout and consolidation below this range would be an ideal signal for selling, with the next target at 1.1320. The furthest bearish target is 1.1267, where I would take profit. A test of this level would break the bullish market structure.
If EUR/USD continues moving upward in the second half of the day, and bears show no significant activity around 1.1435, buyers could drive the pair up to 1.1487. I plan to sell only after a failed consolidation at that level. Alternatively, I plan to open short positions immediately on a bounce from 1.1530, aiming for a 30–35 point intraday downward correction.
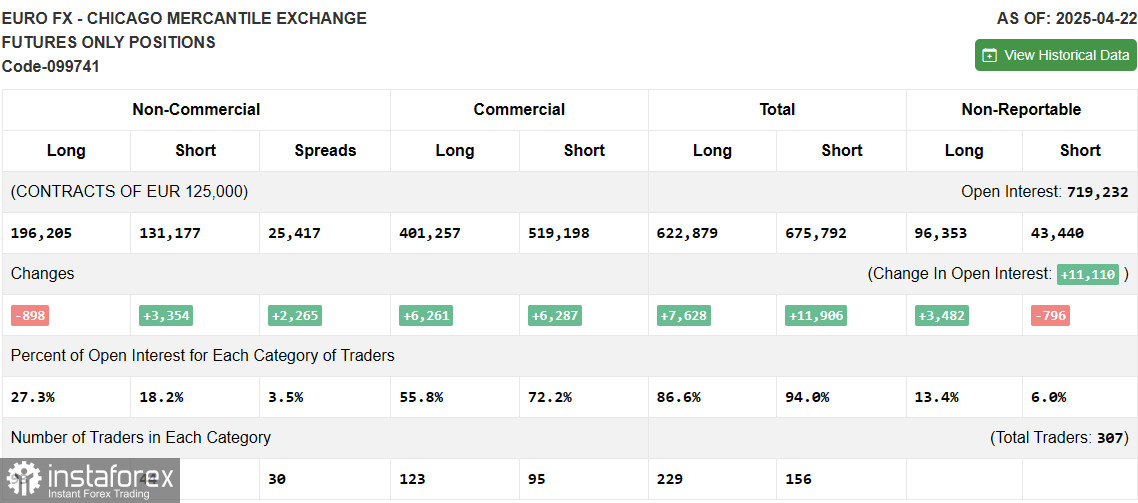
Commitment of Traders (COT) Report - April 22:
The COT report showed an increase in short positions and a decrease in long positions. Considering that the European Central Bank is almost openly signaling further interest rate cuts, this factor prevents the euro from continuing its growth against the U.S. dollar. Meanwhile, easing measures by Donald Trump and a potential compromise with China on a trade deal are gradually bringing U.S. dollar buyers back into the market.
In the near term, the key drivers will be U.S. economic growth data for Q1 and labor market figures for April. According to the COT report, long non-commercial positions decreased by 898 to 196,205 and short non-commercial positions increased by 3,354 to 131,177. As a result, the gap between long and short positions narrowed by 2,493.
Indicator Signals:
Moving Averages Trading is occurring near the 30- and 50-period moving averages, indicating market uncertainty. (Note: The period and prices for moving averages are considered on the H1 hourly chart by the author and differ from the classical daily moving averages on the D1 chart.)
Bollinger Bands In the event of a decline, the lower boundary of the indicator around 1.1378 will act as support.
Indicator Descriptions:


